Understanding Your Hearing Test Chart and Results
Hearing tests can be confusing at first, with unfamiliar graphs, symbols

By: admin | March 25, 2026
Hearing tests can be confusing at first, with unfamiliar graphs, symbols and decibel numbers.
But once you know what you’re looking at, the chart tells a clear story about your hearing. An audiologist helps you understand the parts of your hearing test chart so your results actually make sense, not just as lines and numbers on a page.
Your hearing test results are shown on an audiogram. It shows the sounds you hear at different pitches and volumes, and where your hearing is strong, needs support and how each ear compares.
Reviewing your results helps you understand situations like following conversations in noisy environments, setting device volumes or deciding whether to consult an audiologist. Like blood pressure or vision checks, hearing tests provide valuable health information to help monitor your hearing.
A hearing test gives you a clear look at how well you hear different sounds and pitches. It’s not just about finding out if there is hearing loss, but also about seeing where your hearing is stronger or where it might need some support.
Checking how you respond to various tones and volumes, a hearing test can reveal patterns that affect daily listening, like keeping up with conversations in noisy places or picking up subtle background sounds. The results give you information to help make decisions about your hearing.
A hearing test also helps guide what to do next if changes are found. The results can show whether tools like hearing devices or other strategies might make communication easier.
It also gives you a baseline, so you have a point of reference to track your hearing over time. Overall, a hearing test is a simple, proactive way to understand your hearing, address small challenges early and keep everyday listening as smooth and comfortable as possible.
A hearing test chart, often called an audiogram, is a visual summary of how you hear different sounds.
It uses a grid to display the softest sounds you can detect at different pitches, from low to high. On this chart, symbols indicate the hearing threshold for each ear at each pitch, showing how loud a sound had to be before you could hear it.
This layout makes it easier to see how your hearing responds to a variety of sounds commonly used in speech and listening. The chart also lets you compare how each ear performs and see whether your hearing remains consistent or changes across different pitches.
Some areas of the chart may show that sounds are detected easily, while others may reveal where hearing becomes more difficult.
When all the points are viewed together, they create a pattern that helps explain how your hearing functions in real situations. This visual overview provides helpful context when discussing your results and deciding what steps may support clearer communication.
Sound is measured using two main factors that help describe what you hear during a hearing test. One tells us how high or low a sound is, while the other shows how loud it must be before you can detect it.
These measurements work together to show how your ears respond to different sounds in your environment, including speech and environmental noise.
Here is what these measurements represent:
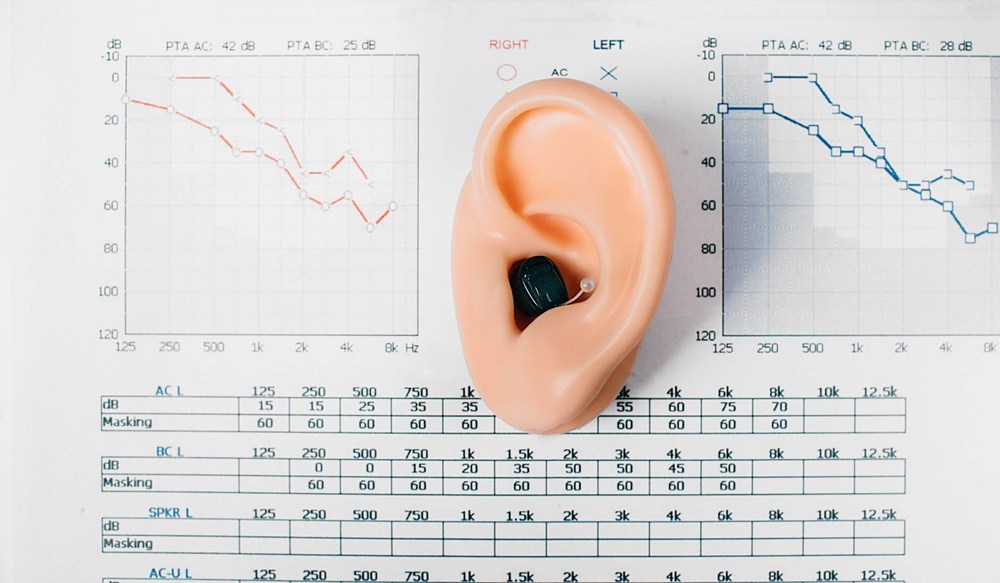
When you look at a hearing test chart, you will usually see a series of Xs and Os placed at different points across the graph.
These symbols are used to record the results for each ear during the test. The O marks show the levels for the right ear, while the X marks show the results for the left ear. Each symbol represents the softest sound you were able to hear at a specific pitch during the test.
Every time you respond to a tone, that response is marked on the chart with the correct symbol for the ear being tested. The position of the symbol on the graph shows both the pitch of the sound and how loud it had to be before you could hear it.
Using Xs and Os to separate the two ears, the chart makes it easier to see how each ear performed during the test and to review the results clearly.
After the Xs and Os are placed on a hearing test chart, they are often connected with lines to make the results easier to read.
Each line represents one ear and links together the points where sounds were heard at different pitches. Instead of looking at each symbol on its own, the line helps show how hearing changes as sounds move from lower to higher pitches.
Reading the lines for each ear lets you see how hearing responds across the chart. One line represents the right ear and the other represents the left, making it easier to compare how both ears responded during the test.
The position of the lines on the chart shows how loud sounds needed to be before they were heard. Looking at the lines together provides a straightforward way to review the results and understand how each ear performed during the evaluation.
A hearing test chart shows how well you can hear sounds at different pitches and volumes. When hearing falls within the typical range, the results usually appear within a certain area of the chart.
While an audiologist will explain the full meaning of your results, there are a few common patterns that often suggest hearing is within normal limits.
Different levels of hearing loss appear on a test chart when the marks fall below the typical hearing range.
The farther the results move down the chart, the louder a sound must be before it can be heard.
This pattern helps audiologists see how much sound is needed across different pitches. It also helps explain why some people may hear certain sounds clearly but struggle with others, especially softer speech.
Hearing loss is often grouped into levels based on the volume needed to detect sound. Mild hearing loss usually falls between 21-40 decibels dB, while moderate hearing loss ranges from 41-55 dB.
Moderately-severe hearing loss appears between 56-70 dB, severe hearing loss falls between 71-90 dB and profound hearing loss is 91 dB or higher.
Seeing where the results land on the chart helps show how hearing changes across different sounds and gives a clearer picture of what someone may experience in daily conversations.
Background noise can affect your hearing test scores. Even small sounds in the room, like air conditioning or distant conversation, may make it harder to hear test tones.
Extra noise can lead to results that suggest more hearing loss than you actually have, so testing is done in a quiet space for the most accurate results.
As you age, changes in your inner ear and how your brain processes sound can affect your hearing test results.
You may notice more difficulty hearing high-pitched sounds, speech may sound muffled even when it is loud enough and background noise can become more distracting. These changes are normal parts of aging and appear as shifts in the lines or symbols on your chart.
After reviewing your hearing test results, it can be helpful to ask a few questions, so you clearly understand what the chart means for your daily life.
An audiologist can walk you through the details, but asking thoughtful questions can make the conversation more useful and ensure nothing important is overlooked.
Some questions to ask include:
These questions can help turn test results into practical information you can use to better understand and manage your hearing health.
Tracking changes in your hearing can help you notice small differences before they affect your daily communication. One helpful approach is to pay attention to situations where listening feels different from how it used to.
For example, you might notice that conversations in busy places take more effort or that certain voices are harder to follow.
These moments can provide useful clues about how your hearing may be changing over time. Keeping mental or written notes about when these experiences happen can make it easier to recognize patterns.
It can also be helpful to compare your current hearing with past experiences.
If you find yourself raising the volume on devices more often or asking people to repeat themselves, those changes may be worth noting. Scheduling hearing tests at regular intervals provides a way to measure these differences over time.
Your hearing test results can make a big difference in how you think about your hearing health.
When you know what the symbols, numbers and lines on the chart represent, the information becomes much more useful. Instead of feeling confused, the chart becomes a practical way to see how you hear different sounds and how each ear performs.
This knowledge can help you better understand everyday listening situations and recognize when it might be helpful to take the next step in caring for your hearing.
If you have questions about your results or want help reviewing your hearing chart, speaking with our audiologists can make the process much clearer.
Our team at Hearing Aid Consultants of North Mississippi in Oxford, MS, can walk you through your results and discuss what they mean for your daily listening needs. If you would like to schedule a visit or learn more, you can contact us at (662) 234-1337.
Hearing tests can be confusing at first, with unfamiliar graphs, symbols
By: admin | March 25, 2026

Your home is where you spend a significant portion of your time, and it
By: admin | October 20, 2025
Walking into a hearing clinic for the first time can feel like entering
By: admin | July 29, 2025